Netstat is a command-line utility found in Windows, Mac, and Linux Operating Systems. When used with the right switches combinations it can provide very useful information when analyzing network connectivity, network performance, and network troubleshooting affecting a single host. Netstat will not show you the entire network picture nor will it directly display issues occurring in your environment, it does provide information relevant to the network sessions on the computer, and when that data is aggregated with other data sources, you can have a clear picture of the network connection.
The description of the command says it all: “Displays protocol statistics and current TCP/IP network connections”. In this article, we’ll go over the basics plus a few good examples that will help you understand and properly utilize netstat.
With that in mind let’s go over the command:
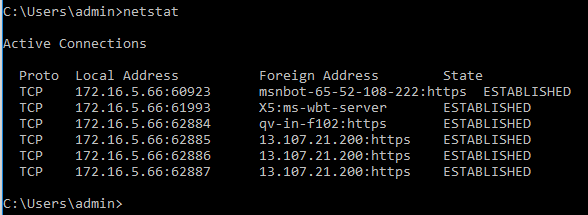
The default output of Netstat displays the connections and listening ports running on TCP.
The information is simple and very useful:
Protocol: This is the transport protocol for the sessions, the default state is TCP but the output can be changed to UDP.
Local Address: It displays the address where the session was initiated from, it includes all addresses with a session including the local loopback adapter. The number after the addresses represents the Port used for the communication with the
Foreign Address.
Foreign Address: It will show the address of the “remote” host for the specific session. Keep in mind the Foreign means the other end of the communication session, be it local or remote, in the case of the Loopback adapter session your own computer name is considered Foreign Address as it keeps the session used by processes and applications. For the address assigned to your physical interface Remote means a host it’s communicating with, be it in the same network, another network, or the internet.
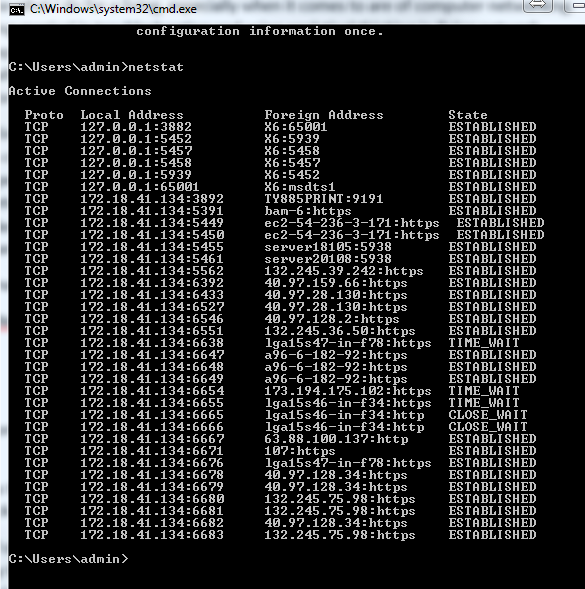
Let’s go over the first line of the command, when looking at the output of netstat pay attention to the columns titles as they tell you what information you are looking into.
- The first column shows the (transport) Protocol for the session, in this case is TCP.
- The second column shows the Local Address, in this case the local address represents the local loopback adapter or 127.0.0.1. In the example the local loopback adapter is used by applications, processes, or services for internal communication. The number after the colon (:) is the Port, it represents the port used for the specific session, in our example it’s 3882.
- Third column: Foreign Address, as stated earlier it represents the address at the other end of the communication for the specific session. In our example the foreign address is X6, X6 is the computer name. As in the case for of the local address, the number after the colon (:) represents the port used for communication during the session, in our case it’s Port 65001.
- Lastly, the State column represents the status of the communication or transport session. In our case we see the session as Established, the other possible states are: Time_Wait, Sync_Sent, Closed.
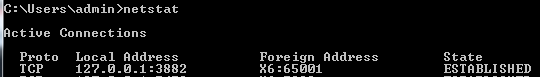
As you keep going down the command output you’ll notice the Local IP address column starts displaying the IP address of the Ethernet interface or interfaces. As stated earlier, the local loopback adapter is used by processes or services for internal communication, if your system does not have applications that rely on the local loopback adapter there may be a case when you don’t see any loopback adapter sessions like the example below:
As with any other external command in a Windows environment, you can get help on it by typing /? or help after the command, so you can use netstat /? or netstat help to learn more about it. Another interesting point to pay attention to is that the command varies slightly depending on the OS and version you are using. In a Microsoft Windows environment, for instance, you will notice that when executed from Windows 10 netstat has more features than when executed from Windows 7. The differences are not related to the core functions but rather to extra functionality, the same can be said when running the command Mac or Linux computers.
For the sake of this article, we’ll use netstat from a Windows 10 environment.
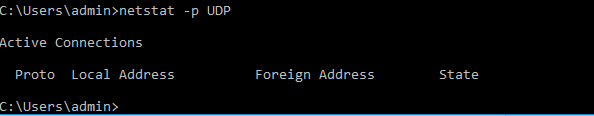
As mentioned earlier the default output of netstat is to display TCP sessions but it’s not limited to it, it also shows information about UDP sessions and statistics about ICMP. To display information on UDP you can use netstat –p UDP, the –p (for protocol) switch allows you to specify the specific protocol and corresponding version(v4 or v6), if there are no established UDP sessions the output will be blank:
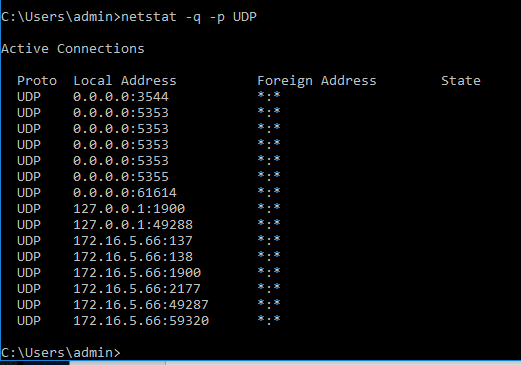
You can, however, look at the UDP listening ports by either: using netstat –a, which will provide information about all sessions using TCP and UDP. It may take a few seconds for the command to finish displaying the output if it’s offloading all session information from memory including TCPv6 and UDPv6 or you can use netstat –q –p UDP. Notice that the example above did not display any UDP session information because there is no active or inactive UDP session. We can interpret the same from the example below but this time by using the –q switch we force netstat to display all listening connections even if they are not associated or bound to any specific connection.
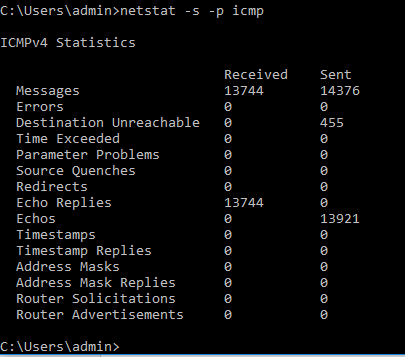
Another very useful command combination is netstat –s (s for statistics), as the name implies it shows statistic information about the protocols: TCP, IP, ICMP, and UDP on version 4 and 6. For most networks just looking at the TCP, and IP protocol statistics will suffice for troubleshooting as it displays information about errors, discarded packets, reset connections, concurrent connections, etc. Now you can how useful this can be, with such information you can determine if the host is under DDoS attack, potential hardware issues, fragmentation issues, etc.
If you simply type netstat –s you’ll notice two or three pages worth of information as it displays statistics about TCP,IP, UDP, and ICMP. You can narrow down the results to a specific protocol by using the –p switch and specifying the protocol. For instance, to display ICMP statistics you can use: netsat –s –p icmp, the true is the same for TCP, IP, and UDP.
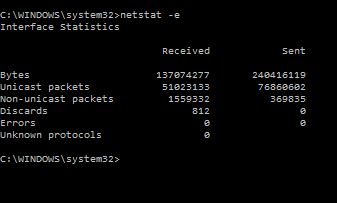
Most LANs nowadays work on Ethernet technology, netstat provides basic information about Ethernet by using netstat –e. Being able to take a quick look at the Ethernet statistics from a faulting host can definitely steer your time and effort in the right direction. If you see lots of Discards or Errors you may deduce the issues may be some type of L1 or L2 issue. Netstat -e
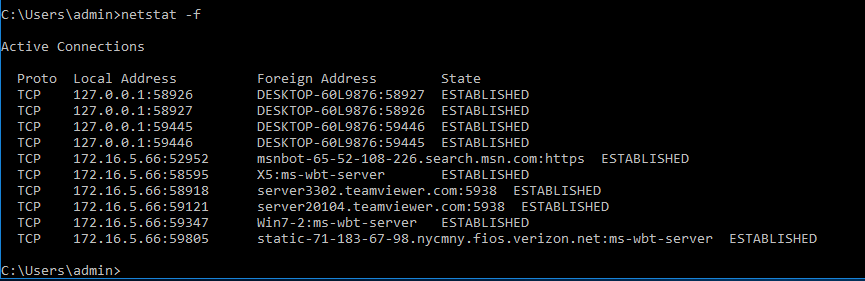
One of the beauties of netstat is the ability to display session information, to get more relevant information about the sessions you can use the –f switch, by default the foreign addresses are displayed just by hostname but when using netstat –f the foreign addresses will be resolved to their fully qualified domain names. It actually makes more sense using –f when troubleshooting compromised hosts either by virus and hackers as it can display more relevant information about where they’re coming from. Netstat -f
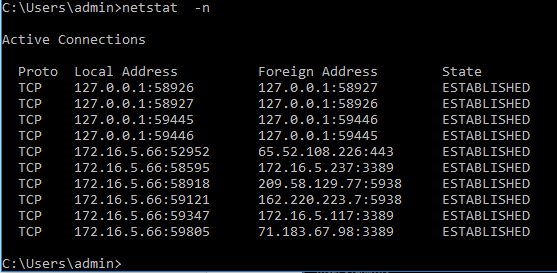
The –n switch is the opposite of –f. The –n switch will display the foreign addresses by their IP address instead of the host of a fully qualified domain name. Very useful in determining if a remote host is local or in another network, it’s also less cluttered than the other options. Netstat –n
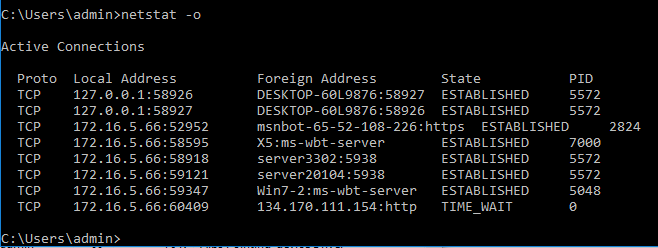
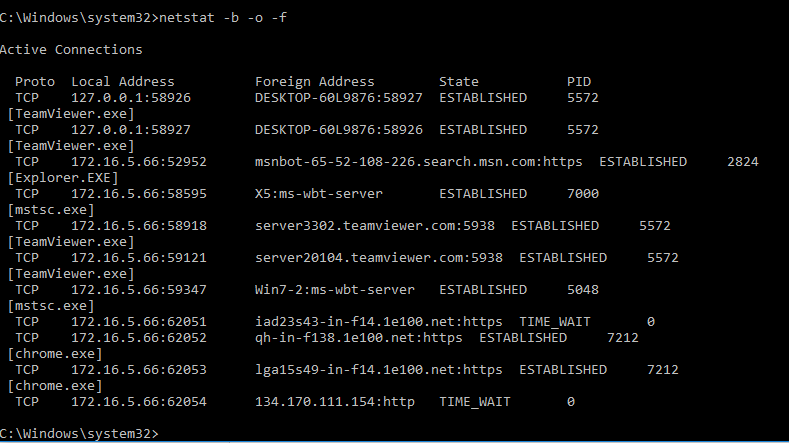
For some time I’ve been mentioning how netstat displays session information, to further elaborate the point let’s go over two of the most important switches: -o and –b. For now let’s go over -o, it shows the process identifier or process id (PID) used for each connection. In a Microsoft Windows environment, you can use Task Manager to display the processes used by the applications, in other words, you can correlate the session information to the application by using the process id (PID). In our example below I have a few established sessions between my computer and a server3302:5938 and server20104:5938 remote hosts, the process handling that session is PID 5572.
The following is the output of netstat –o
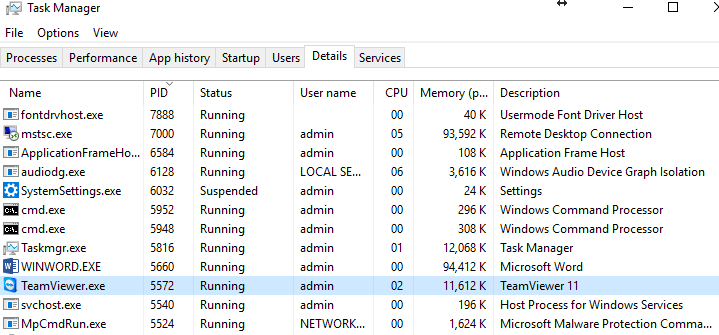
In and of itself the information may not be too relevant but if I use Task Manager or any other utility that displays processes information, like sysinternals process ID, you’ll be able to dig deeper into what’s happening in the system.
Notice how by using Task Manager you can learn more information about the network sessions by correlating the PID. In our case, those two-session managed by process 5572 reveal that they are TeamViewer connections. In my case, it’s perfectly fine because I have the Teamviewer as one of my applications, it may raise a red flag if I hadn’t initiated TeamViewer and seen established connections.
Another useful switch to use is –b, netstat –b “displays the executable involved in creating each connection or listening port.” It can’t be clearer than that and when you combine the –b and –o switches it will display the executable initiating the session plus the process IP (PID) to determine what application running the process. This is one of those” go-to” commands I first used when troubleshooting hosts that have been compromised, I usually add the –f to have a clearer view of the connections. Netstat –b –o –f
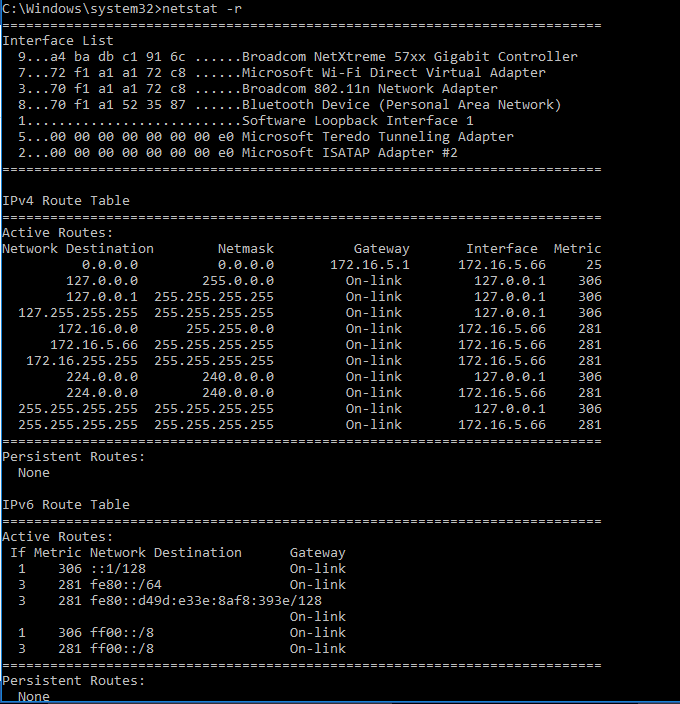
Another handy way of using netstat command is netstat –r, the –r will make display the routing table for IPv4 and IPv6. Another useful information in the output in the Interface list along with their MAC addresses.
As you can see netstat is a versatile tool, it is one of those utilities that once mastered can make network troubleshoot easier as it displays information about the sessions, protocols, interfaces, etc. I have personally used it over and over to help me determine what the issue is or guide me in the right direction.
I hope it can be useful to you, feel free to drop a note or comment.
_________________________________________________________________________________________________________________________________________
About JDTech: We provide network and information security services to small and medium-sized in northern NJ and NYC. We specialize in network engineering, troubleshooting, and administration. You can count on us as your dedicated IT experts or as an extension of your IT department, Feel free to contact us at www.jdtechsolutions.net or 888-580-4450.